Majority of climate change indicators show things got worse in 2021, scientists say
Four key climate change indicators set records in 2021 — a year that was among the seven warmest on record.
Scientists outlined their findings in the World Meteorological Organization’s annual State of Climate report that was released Wednesday.
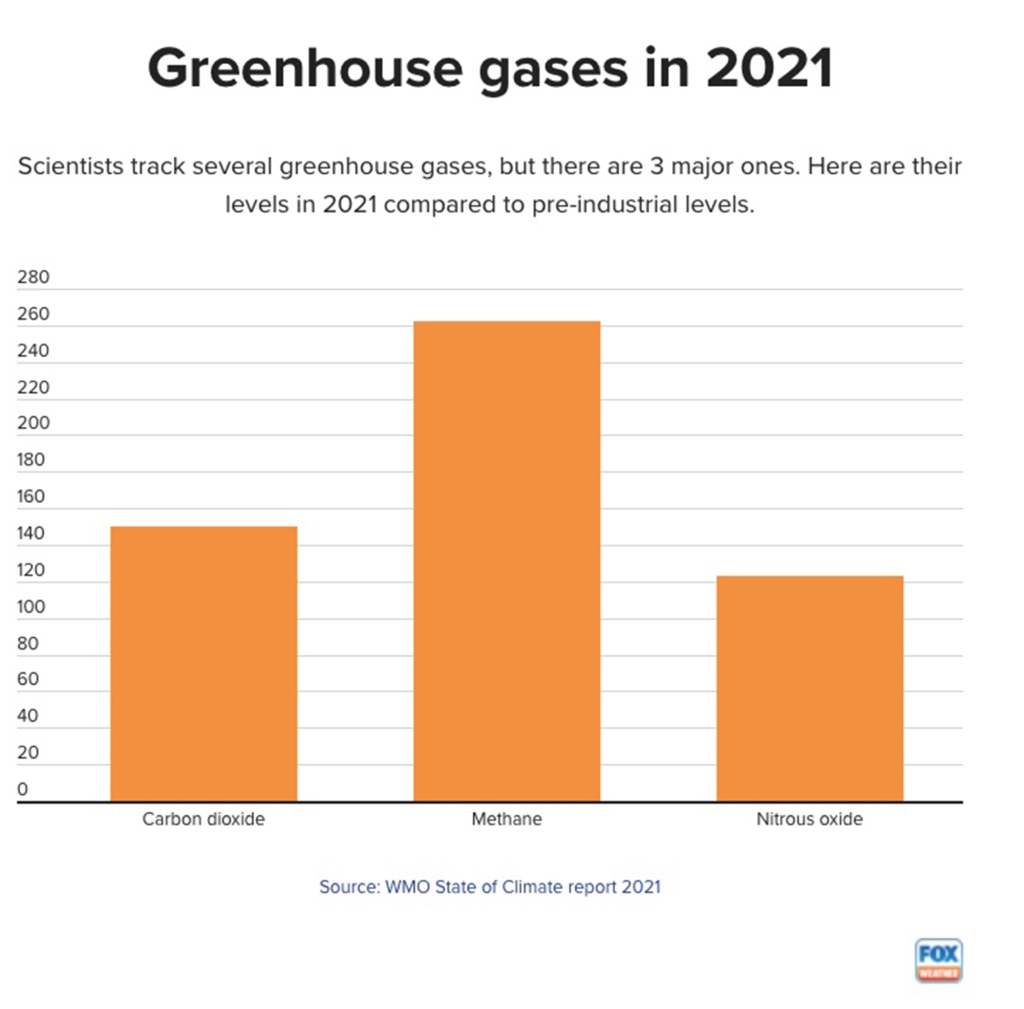
According to the report, four of the seven indicators scientists use to describe climate change hit new highs — greenhouse gases concentration, sea-level rise, ocean heat and ocean acidification.
“Our climate is changing before our eyes,” WMO Secretary-General Petteri Taalas said in a statement about the agency’s report. “The heat trapped by human-induced greenhouse gases will warm the planet for many generations to come. Sea level rise, ocean heat and acidification will continue for hundreds of years unless means to remove carbon from the atmosphere are invented.”
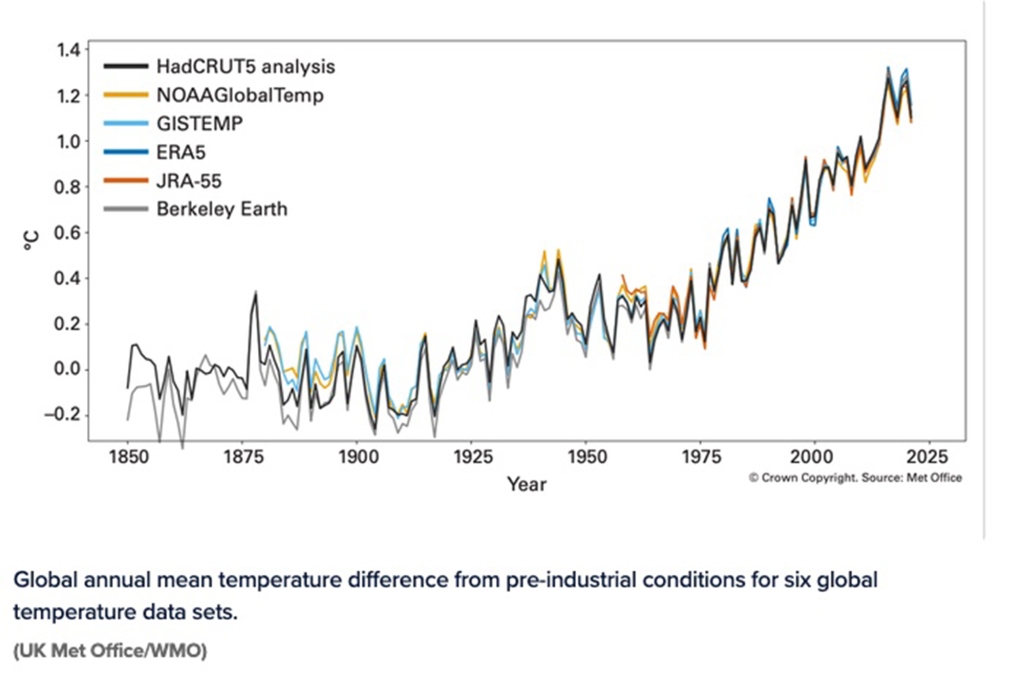
Scientists also said that the past seven years have been the warmest on record. They said temperatures in 2021 were 1.11 degrees Celsius above pre-industrial levels, inching the planet closer to the 1.5-degree warming threshold scientists said will lead to major effects on the planet. A cooling La Niña event at the start and end of 2021 kept it from being the warmest year on record, scientists said.
Global annual mean temperature difference from pre-industrial conditions for six global temperature data sets.
“It is just a matter of time before we see another warmest year on record,” Taalas said.

What are the 7 climate change indicators?
The World Meteorological Organization uses 7 indicators to describe climate change:
Greenhouse gases
Increasing levels of greenhouse gases in the atmosphere are a major driver of climate change.
Global temperature
As concentrations of greenhouse gases increase, so does the global mean surface temperature.
Ocean heat content
Most of the excess energy in the environment because of greenhouse gases goes into the ocean.
Sea-level rise
As ocean temperatures increase, sea levels rise. This rise isn’t equal across the planet.
Ocean acidification
Some CO2 emissions are absorbed by the ocean, where it interacts with saltwater and increases the acidity.
Sea-ice extent
This is a measure of how much ice covers the ocean. It serves as an indicator of climate change in polar regions where changes can have widespread effects.
Glacier mass balance
Glaciers provide freshwater to millions around the world and their loss has significant impacts on global climate.

Read the full article Here


